How to debug Istio Upstream Reset 502 UPE (old 503 UC)
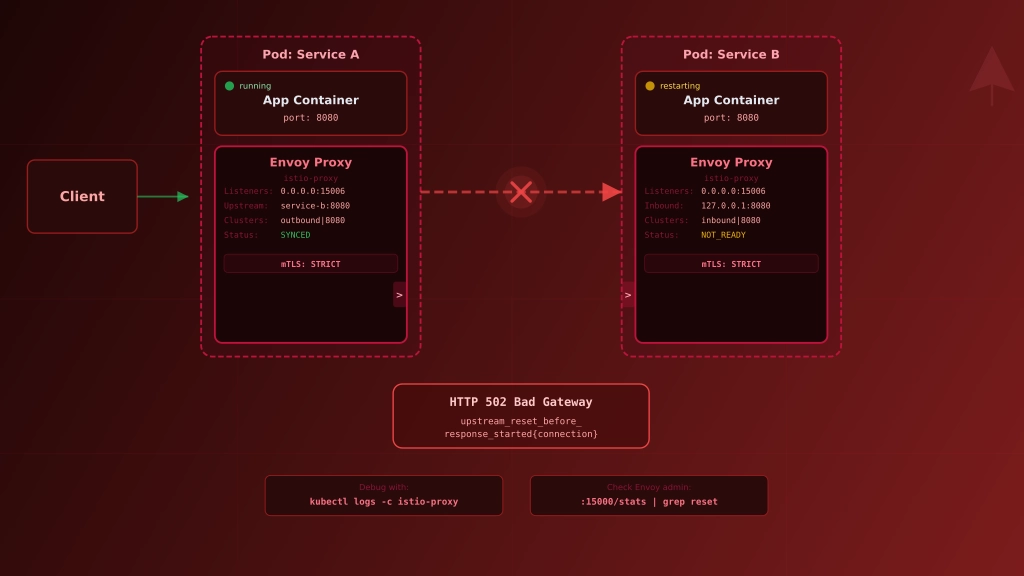
Istio is a complex system. For the applications, the main component is the sidecar container Istio-Proxy, which proxies all traffic from all containers in Pod. And this can lead to some issues.
This post describes one of the most complicated problems I have encountered in my career.
The problem - Connection Reset 🐛
During Istio rollout on a huge system, with more than 40 different microservices, on a single endpoint, QA engineers found a bug. It was a POST endpoint, which was returning chunked data.
Istio was returning error 502, in logs an additional flag was visible: upstream_reset_before_response_started. The application logs confirmed that the result was correct.
In legacy Istio versions of the presented problem Istio were returning
503error withUCflag.
Analyzing issue ⛏️
Let’s see the curl response and look at Istio-proxy logs:
kubectl exec -it curl-0 -- curl http://http-chunked:8080/wrong -v
< HTTP/1.1 502 Bad Gateway
< content-length: 87
< content-type: text/plain
< date: Sun, 24 Apr 2022 12:28:28 GMT
< server: istio-envoy
< x-envoy-decorator-operation: http-chunked.default.svc.cluster.local:8080/*
upstream connect error or disconnect/reset before headers. reset reason: protocol error

$ kubectl logs http-chunked-0 -c istio-proxy
[2022-04-24T12:23:37.047Z] "GET /wrong HTTP/1.1" 502 UPE upstream_reset_before_response_started{protocol_error} - "-" 0 87 1001 - "-" "curl/7.80.0" "3987a4cb-2e0e-4de6-af66-7e3447600c73" "http-chunked:8080" "10.244.0.17:8080" inbound|8080|| 127.0.0.6:39063 10.244.0.17:8080 10.244.0.14:35500 - default
Time for spying 🕵🏻♂️
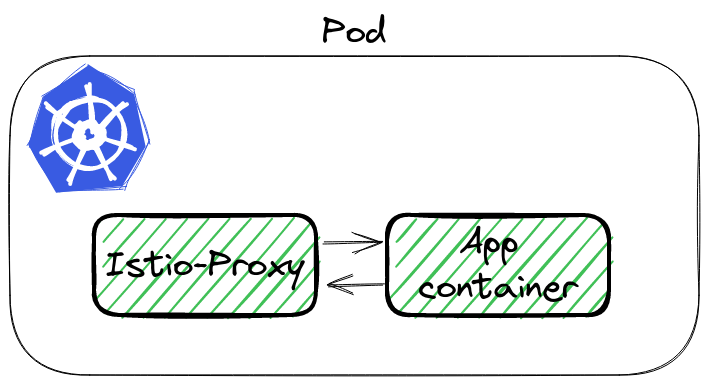
To analyze the traffic we can use tcpdump and Wireshark. Istio-proxy runs as a sidecar, which routes whole incoming and outgoing traffic to pod through own proxy.
To sniff traffic there are 3 ways:
- Running tcpdump in
istio-proxycontainer, - Using
kubectlpluginksniff- a plugin to kubectl to dump packets from pod, github repo, - Adding additional container to pod, with
rootpermission andtcpdumpinstalled,
The first option will not work by default, because istio-proxy runs without root permission. The third is the backup if 1 and 2 would not work. Let’s try ksniff.
What is ksniff 🛠️
ksniff in three words is a plugin that:
- figures out what node is running pod with an app,
- deploys an own pod with an affinity to that node, bound to the host network,
- opens Wireshark on your laptop with a packet stream from the application.
Let’s execute it to sniff our application:
kubectl sniff http-chunked-0 -c istio-proxy -p -f '-i lo' -n defaultImportant parameters
-pis a parameter to support sniffing even if the pod is non-privileged. See docs,-f '-i lo'passes filter to tcpdump, we want to sniff localhost interface inside the Pod.
If there is no issue, our system has Wireshark in PATH, ksniff should open a new window
Finding the root cause 🔎
Wireshark will continuously follow with new packet records. It makes it hard to figure out our particular call. We can use filters to help with searching. Knowing the request path, method, response code - we can use it to find our packet using filter:
http.request.uri == "/wrong"It shows only a single packet, our request. Wireshark allows to show the whole TCP conversation:
- click right click on the packet,
- go to
Conversation Filter, - select
TCP.
Wireshark will write a filter to show the whole communication between istio-proxy container and the application container!
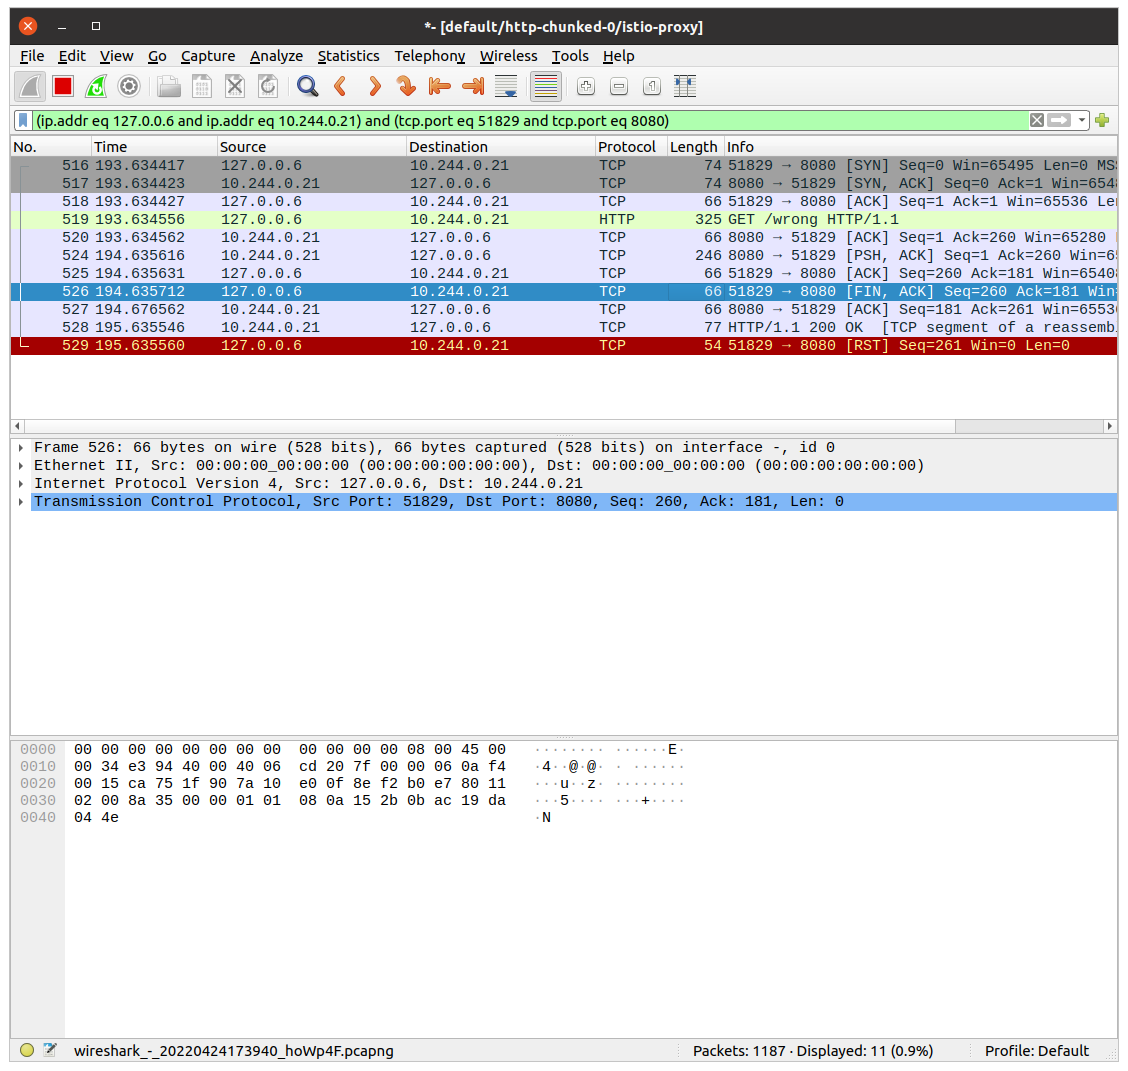
Let’s see the above image. The first 3 records are the three-way handshake packets. Later is our GET request. The most interesting happens in the last two packets. Application container returns response HTTP 200 OK. istio-proxy then closes the connection with RST packet.
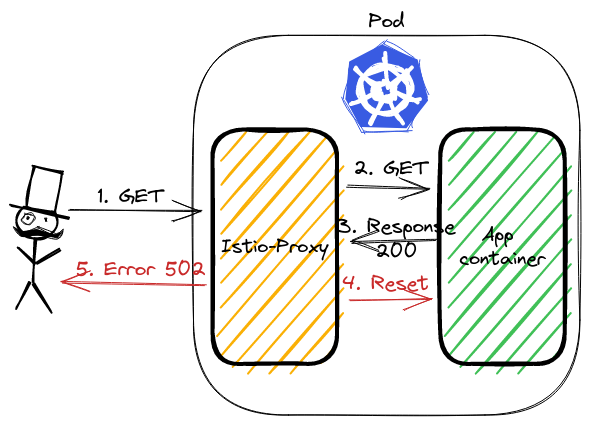
This is what we saw in the logs. The flag was upstream_reset_before_response_started{protocol_error}. But why? This still does not explain.
Swiss knife by Wireshark 🪛
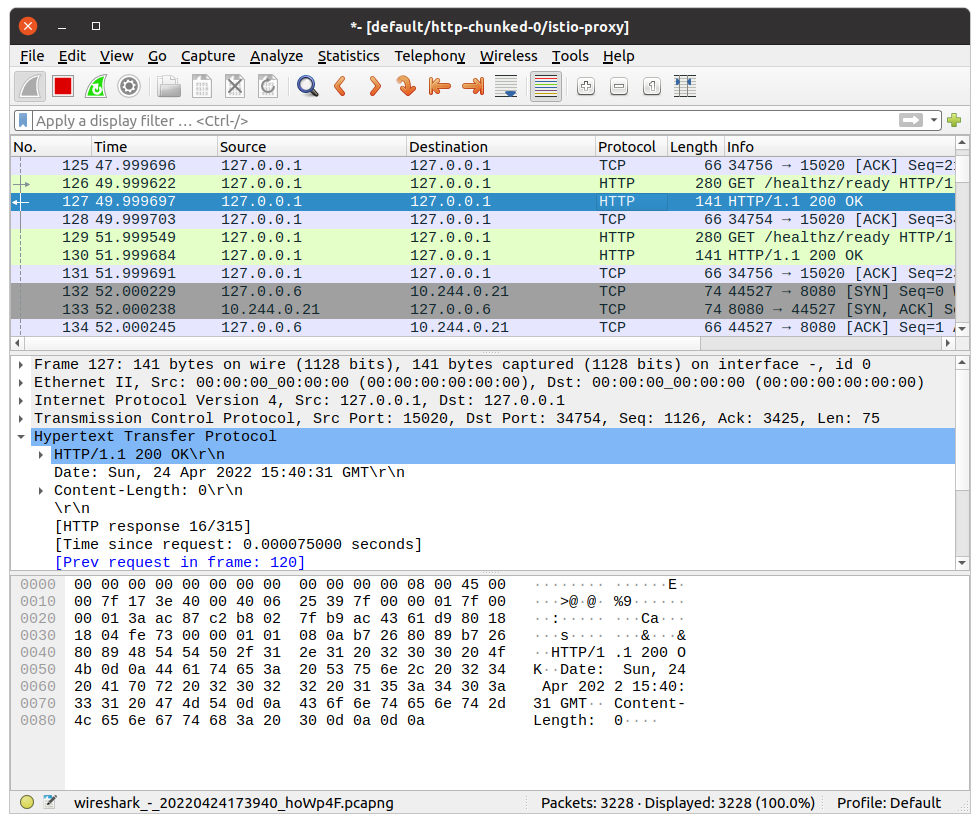
It is hard to read the HTTP protocol from multiple packet bodies. But Wireshark also has a solution for that. We can see data from L7, the application one. In our case, it is the HTTP protocol.
Click with the right mouse on a single packet, go to the Follow tab, and select TCP Stream:
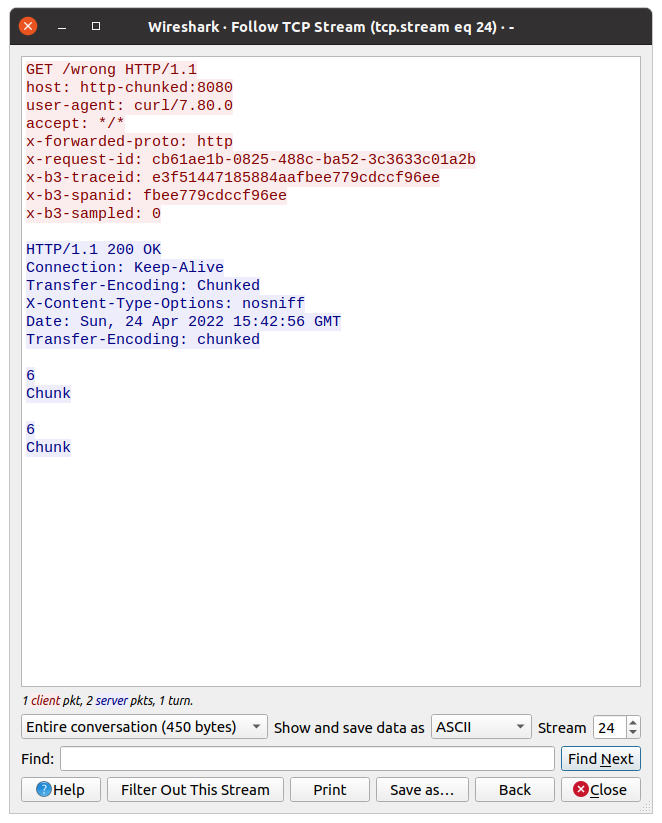
Now we can check what the request from istio-proxy looked like, and what was the response from the app.
Do you have an idea from the above picture?
Look closer at the response, there is a double Transfer-Encoding header. One starts from uppercase, the second one does not.
Double transfer-encoding header - what does it mean❔
Searching over Istio issues I found this answer. The most important are the first 2 points:
- two
transfer-encoding: chunkedis equivalent totransfer-encoding: chunked, chunkedas per RFC,transfer-encoding: chunked, chunkeddoesn’t have the same semantic astransfer-encoding: chunked
Why the response was taken as double-chunked? According to Transfer Codings in Section 4, transfer-coding names are case-insensitive.
Summary 📓
As you see, Istio stands as a guard 👮♂️ of the HTTP protocol. If the app is returning a double-chunked response, then Istio requires it, otherwise, it rejects processing the request. curl ignores this inconsistency.
This issue was one of the most difficult tasks, which I ever had :-)
Infrastructure to reproduce and example app 🏭
In Github repository I created example infrastructure to reproduce the problem.
Bootstrap of the infrastructure installs ArgoCD, Istio and the App. The sample app exposes two endpoints:
/correct- endpoint, which creates a streamed response,/wrong- is doing same as above, but additionally it set value of theTransfer-Encodingheader toChunked(uppercase).
I would like to thank Przemysław for his help and for showing me how to use Wireshark efficiently during this issue.🤝🏻

Senior Platform Engineer